- TOP
- Fundamentals of CAE
- 第11回 疲労とクリープ
Series: Fundamentals of CAE Analysis for Plastic Product Design
Part 11 Fatigue and Creep
In designing resin parts, durability and reliability can be improved by properly evaluating fatigue and creep properties and reflecting them in analysis. In this part, we will explain the fatigue and creep properties of plastics and how to analyze them.
2025.02.28
Contents
Introduction
Phenomena such as fatigue and creep require particular attention when it comes to plastic products. These have different properties than metals, so care must also be taken when designing parts that use resin. This time, we will explain about fatigue and creep of resins.
What is fatigue in plastics?
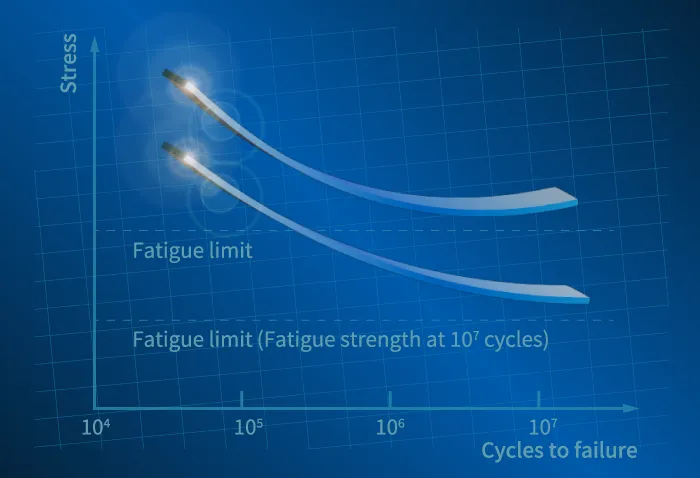
When repeated loads are applied to an object, it may break when the stress is within the elastic deformation and is smaller than the yield stress. This is called fatigue failure. To evaluate fatigue characteristics, an SN curve (fatigue curve) is used, which shows the relationship between the stress (S) repeatedly applied to a material and the number of repetitions (N) until the material breaks. The stress when the curve becomes horizontal is considered to be the fatigue limit. This means that at stresses below the fatigue limit, fatigue failure will not occur, regardless of the number of repetitions.
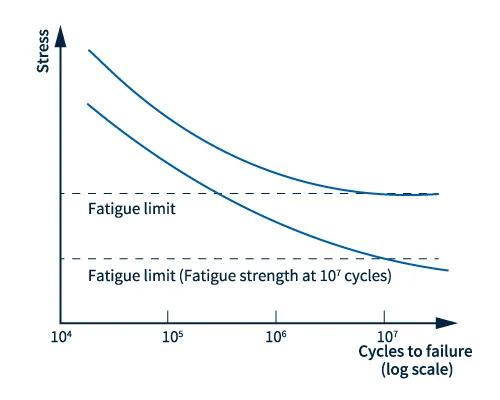 Fig. 1 S-N curve
In the case of plastic materials, there may be no clear fatigue limit. When fracture occurs, the stress at the point when the stiffness retention rate decreases to a certain value or at the point of about 107repetitions may be used as an index of fracture strength as a fatigue limit.
■ Major differences from metal fatigue
Since plastics have viscoelastic properties, there are differences in fatigue failure compared to metals. Metal materials often have a clear fatigue limit, but plastic materials often do not. Many plastic materials continue to deteriorate gradually even after exceeding the specified number (107 times), so care must be taken when determining how to set the fatigue limit.
In addition, plastics are temperature dependent, and as temperatures increase even within the practical temperature range, their fatigue strength tends to decrease.
Furthermore, if the deformation speed is too fast during repeated load testing, heat will be generated internally. As a result, there is a possibility that fatigue characteristics will change, such as causing thermal fatigue failure. This temperature rise is greatly affected by the magnitude of stress and the repeated frequency, so care must be taken when performing analysis.
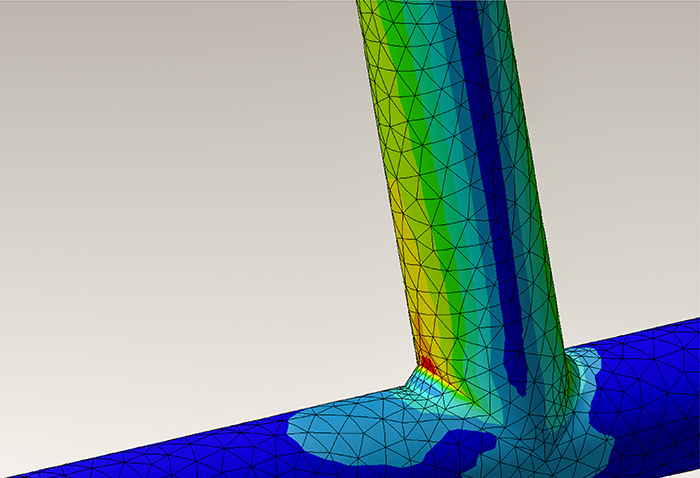
■ Fatigue evaluation using structural analysis (fatigue analysis)
Fatigue failure is one of the major causes of component failure. Therefore, it is necessary to conduct a structural analysis in advance for areas that will be subjected to repeated loads to check whether fatigue failure will occur.
Use the stress values obtained from structural analysis and the fatigue diagram. The fatigue diagram can be obtained by performing a fatigue test or from a material database. If the repeated load is a simple constant amplitude, the life can be calculated from the stress values from the analysis results and the fatigue limit diagram.
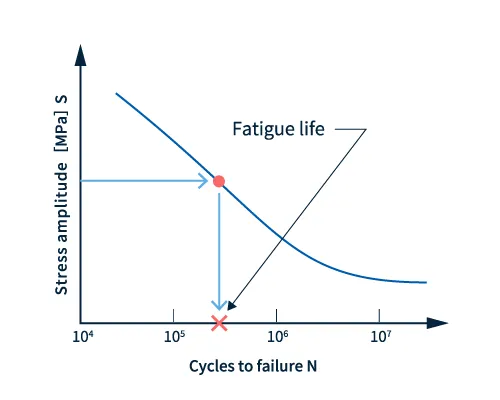 Fig. 2 Life expectancy prediction under constant amplitude load
In the case of non-constant amplitude, the life must be calculated by accumulating the data. Some CAE software can automatically calculate the life by using fatigue analysis.
In addition, it is now possible to calculate fatigue evaluation after mapping the orientation of fiber reinforcement materials, making it possible to perform fatigue evaluation that takes into account the anisotropy of physical properties.
You can also create a modified Goodman plot from the fatigue limit and tensile strength to determine whether fatigue fails or not. The modified Goodman plot is a modified Goodman plot by drawing a straight line with the X-axis as the tensile strength of the intercept σ B and the Y-axis as the intercept fatigue limit σ w.
Next, the mean stress σ m and stress amplitude σ a are calculated from the results of the structural analysis using the following formula. The maximum value σ max and minimum value σ min of the periodic stress fluctuation are also read.
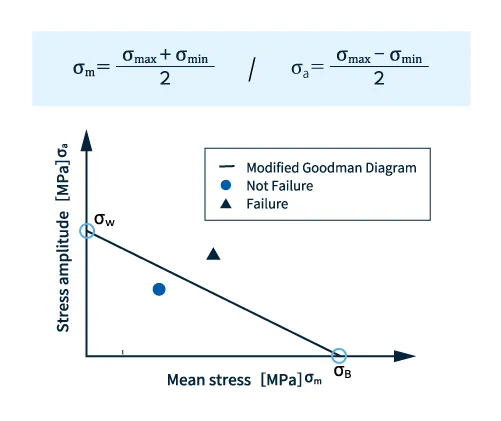 Fig. 3 Modified Goodman diagram
When the obtained mean stress σ m and stress amplitude σ a are plotted on a graph, if they are below the modified Goodman line, it can be determined that there will be no fatigue failure.
However, since fatigue fractures often grow from stress concentration sources, if a product has notches or scratches, its fatigue resistance may decrease. Care must also be taken with the shape when designing products.
What is creep in plastics?
Creep is a phenomenon in which when stress is applied to an object for a long period of time, the strain increases over time. When stress is applied to an object, elastic strain occurs first, and then creep strain occurs over time due to viscosity. If we consider the spring-mass system in the diagram below, the part that corresponds to the dashpot is the part that exhibits the viscosity of the resin, and is a physical property that causes creep strain.
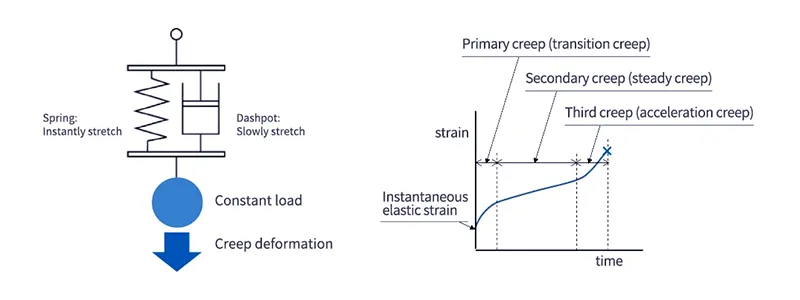 Figure 4: Creep phenomenon model (left) and creep curve (right)
Plastics are prone to viscoelastic properties even within their operating temperature range, so special care is required when plastic products are designed to be constantly loaded. In addition, at high temperatures and high stress, distortion can progress rapidly and ultimately lead to destruction, so when designing a product, it is important to consider whether there are any problems with safety and durability.
■ Creep analysis
There are several methods for formulating creep curves, but the most commonly used creep material model is Norton's law, which expresses the creep strain rate as a function of stress (σ) and temperature (T), as shown in the following formula.
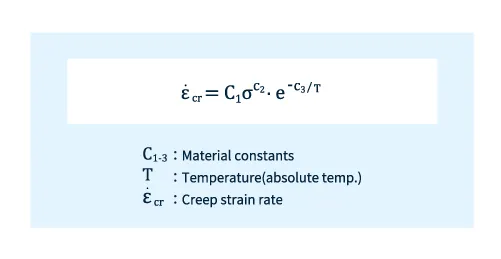 Fig. 5 Norton's Rule
It is necessary to identify the material constants so that they fit the measured creep curve.
Summary
Since plastics have different characteristics from metal materials, such as fatigue and creep, care must be taken when designing products. Use CAE analysis as a reference when designing and selecting plastics to ensure there are no problems with product durability.
In the next part, we will explain Topology optimization for Design.
◆Please also make use of Beam Calculator which is useful for checking the validity of CAE analysis results and understanding basic deformation and stress.
For more information about CAE, please contact us.
CAE Download Slides

CAE Services
CAE Application Case Study
Others


Related information