


Technical Information
Injection molding analysis details
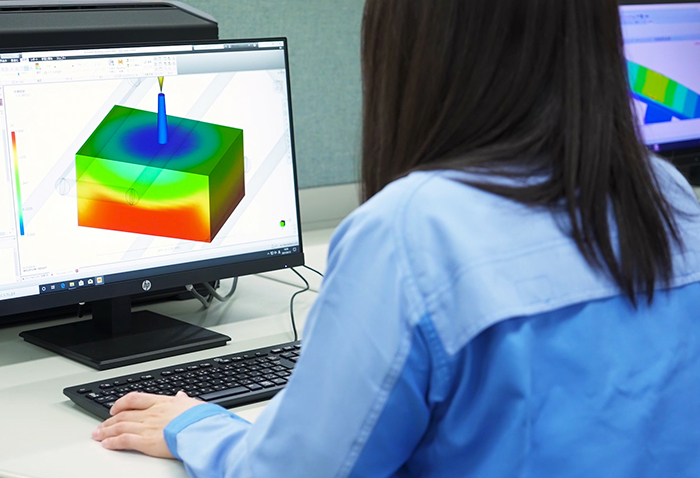
In injection molding analysis, filling and packing analysis and warpage analysis are important simulations in the injection molding process.
Filling and Packing Analysis
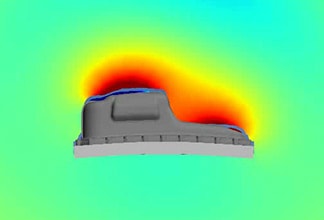
Filling and packing analysis is an analysis that simulates how the resin flows into the mold (filling process) and the subsequent packing stage (applying holding pressure to suppress resin shrinkage). Specifically, it focuses on the following points:
- Filling analysis: This simulates how the resin is injected and fills the cavity inside the mold (the space that determines the shape of the molded product). It determines whether molding is possible or not and optimal molding conditions based on the resin flow, flow speed, temperature distribution, pressure distribution, etc.
- Packing analysis: After filling is complete, the process of applying packing pressure to compensate for the resin cooling and shrinkage is simulated. Check for sink marks, voids, and short shots.
- Cooling analysis: Simulates the cooling behavior inside the mold due to heat conduction and heat transfer. Calculates the mold surface temperature and resin temperature distribution, and considers the layout of the cooling circuit and the temperature of the coolant. Can be coupled with a filling and packing analysis.
.png)
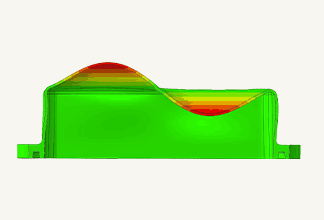
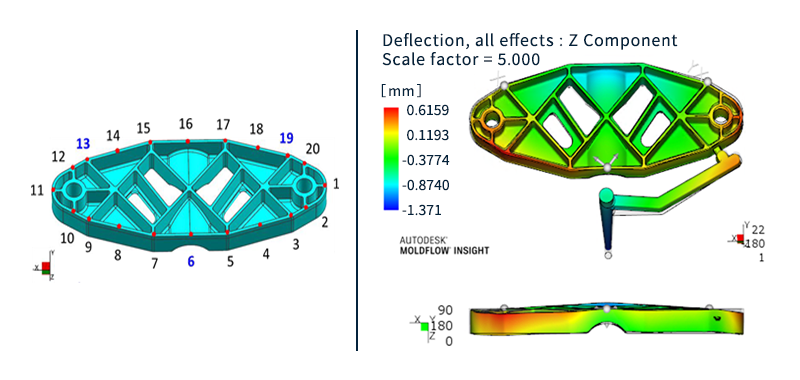
Warpage analysis
In addition to the above-mentioned Filling and Packing analysis, warpage analysis analyzes the warping that occurs during the cooling process of the molded product. It simulates the warping and deformation that occurs due to uneven shrinkage when the resin cools and solidifies after injection molding.
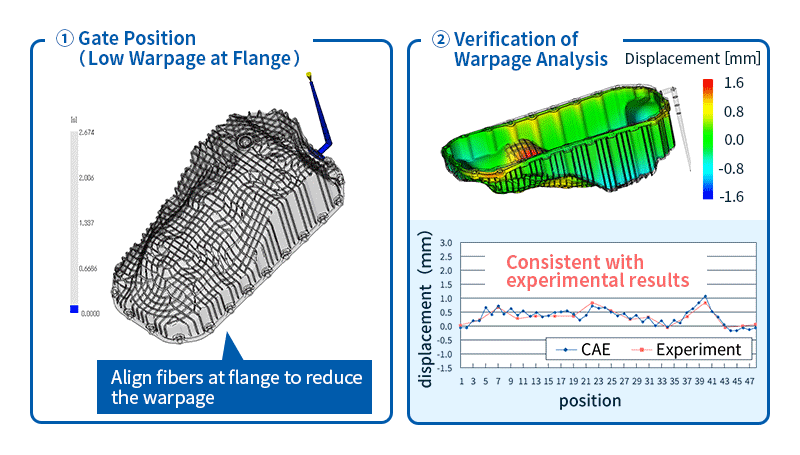
- Warpage analysis: Predicts shrinkage and warpage of molded products after release from the mold based on the results of filling, packing, and cooling analysis. The causes of warpage can be classified into three factors: cooling difference, shrinkage difference, and orientation difference. Once the cause is identified, solutions such as changing the gate position or molding conditions can be considered.
.png)
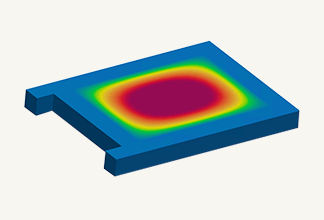
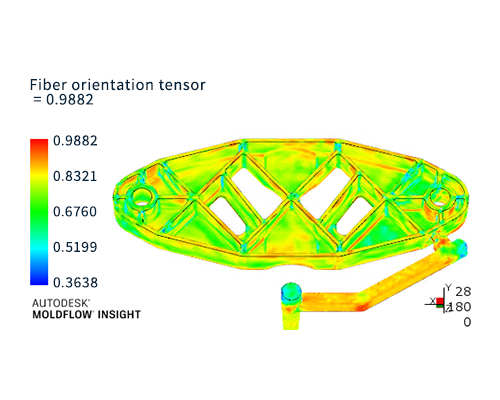
Evaluation of fiber orientation
In the case of fiber-reinforced resins containing glass-fiber, it is important to take into account the fiber orientation, as this can have a significant effect on product performance.
To know fiber orientation information, the fiber orientation tensor is output from injection molding analysis.
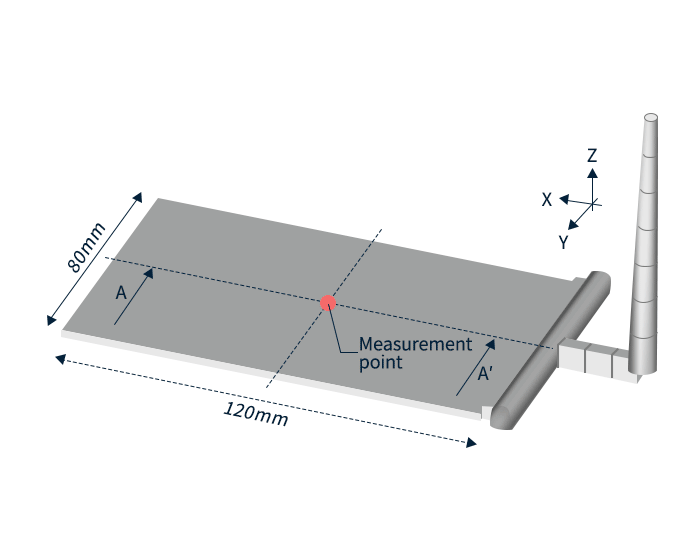
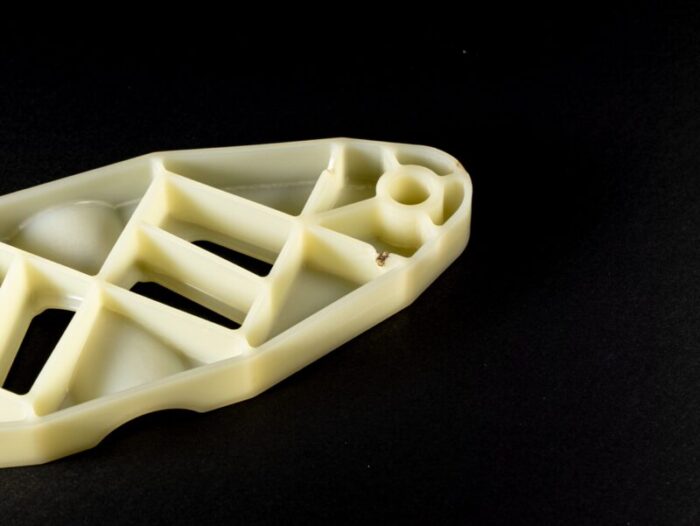
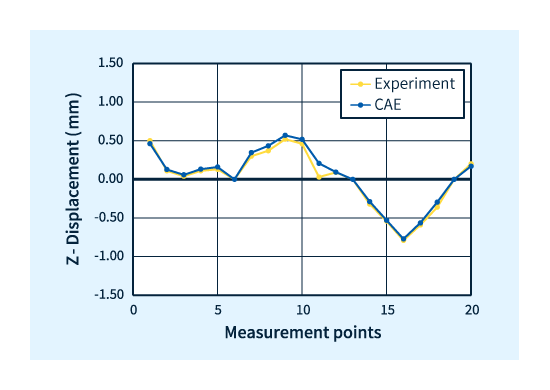
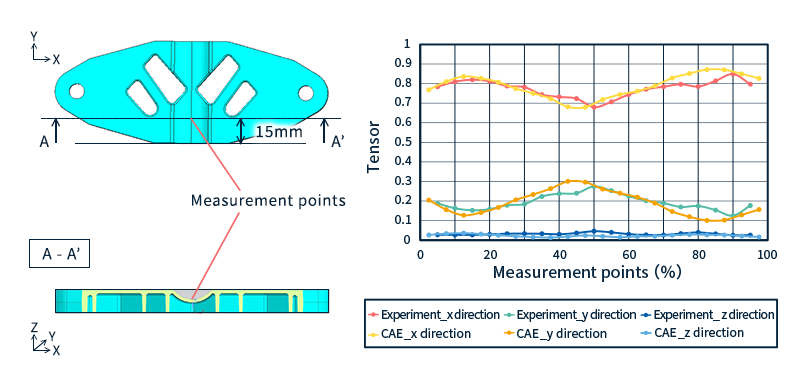
Here we show how an evaluation is performed using a flat test piece (Figure 4).
The fiber orientation tensor is a probability distribution (0 to 1) of the fiber orientation. Here, the fiber orientation tensor is evaluated in three directions: x-axis, y-axis, and z-axis. As the tensor value increases (approaching 1), it means that the fibers are more aligned in each direction.
The measured fiber orientation tensor value was calculated using a unique method from the image of the product cross section at the evaluation position observed with an optical microscope. The fiber orientation tensor was calculated at 5% intervals in the thickness direction of the molded product. The rod-shaped and circular objects in the enlarged image of Figure 4 are glass-fiber.
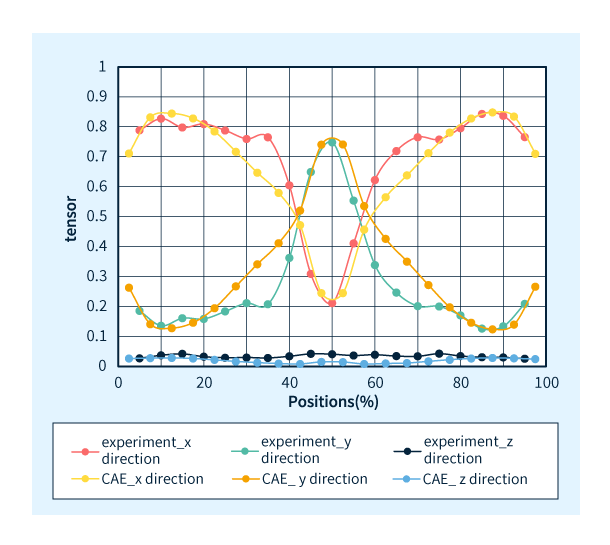
Figure 5 shows the fiber orientation tensor measurements and the analytical results obtained from injection molding analysis.
It can be said that the analysis was able to predict the actual fiber orientation tensor.