For inquiries regarding SDS and various chemical substance investigations, please make your request through your purchasing route, such as via a trading company. We appreciate your understanding and cooperation.
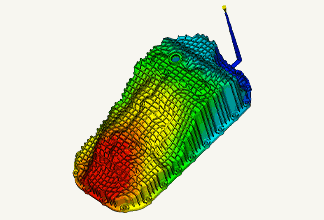
Vibration analysis is an analysis performed to avoid a phenomenon (resonance) in which a vibration equal to the natural frequency of a vibrating body is applied from the outside, and a phenomenon in which it vibrates at a very large amplitude (resonance). Vibration analysis can be broadly divided into "modal analysis" and "frequency response analysis", which are the simplest. Vibration analysis includes Modal analysis and Frequency response analysis.
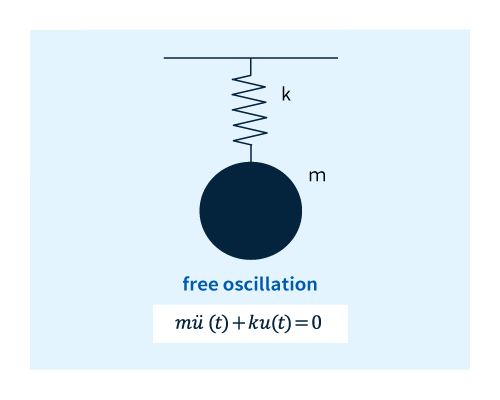
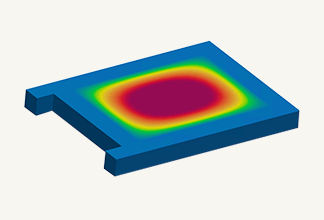
Fig. 1 Modal analysis (eigenvalue analysis)
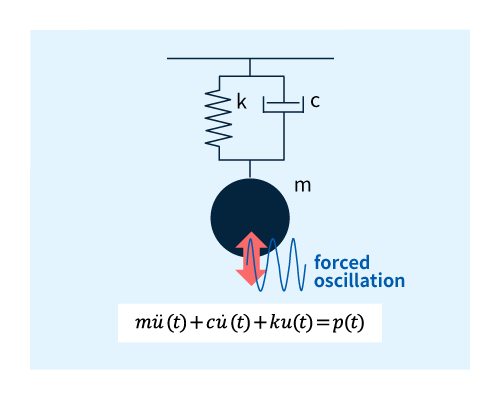
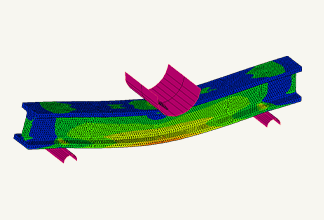
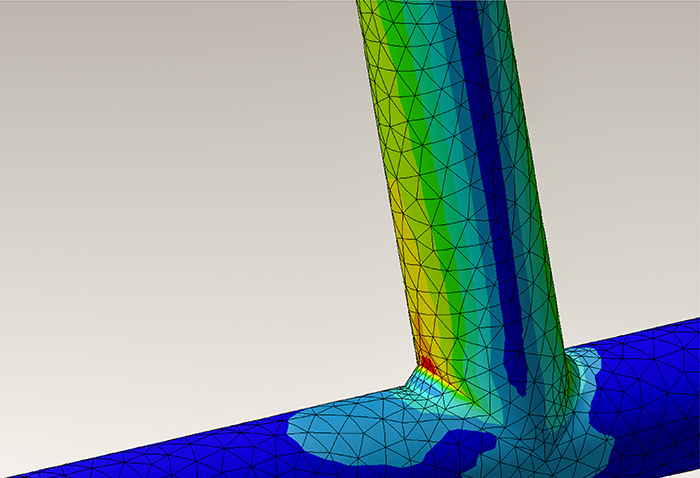
Fig.2 Frequency response analysis
Vibration analysis details
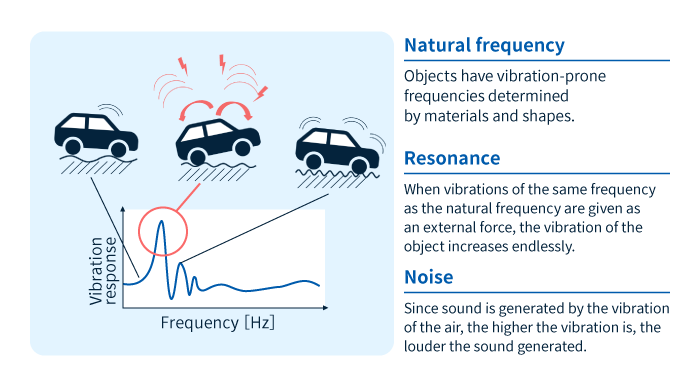
Use for resonance and noise countermeasures
Obtaining vibration characteristics (eigenfrequency and magnitude of vibration) can lead to measures against resonance and noise.
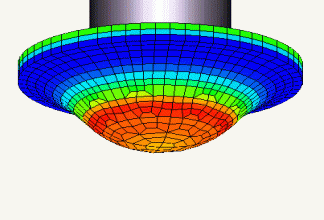
Figure 3 Vibration characteristics
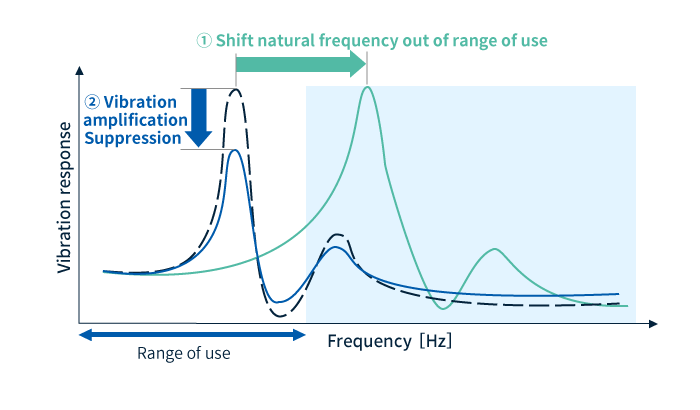
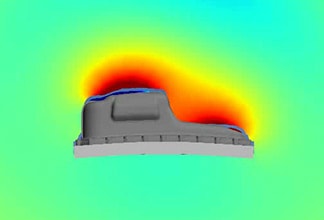
When glass fiber reinforced material is used, the following measures can be taken to prevent resonance and noise. ① Set the natural frequency to a frequency outside the range of use. ② Suppress vibration amplification By examining the glass fiber orientation and adding ribs or changing the rib thickness, it is possible to remove the natural frequency from the frequency range at which the product is used (Fig. 4 ①). In addition, when replacing metal, the viscoelastic properties of the resin will increase the vibration damping effect (Fig. 4 ②).
Fig.4 Resonance and noise countermeasures
Case studies-1
Effect of fiber orientation on frequency characteristics
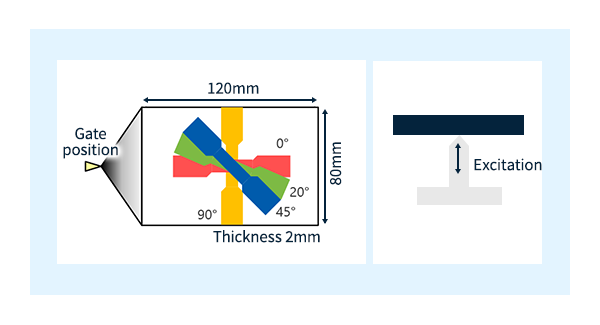
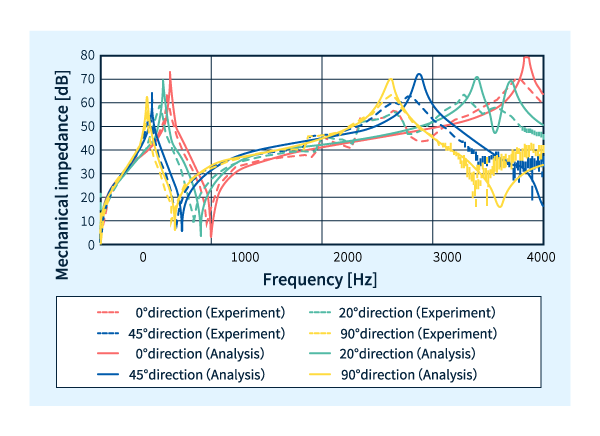
Here is an example showing that the natural frequency can be changed by fiber orientation. As shown in Fig. 5, after forming a flat plate of 120mmx80mmx2mm, we cut it out in each direction and conducted a damping characteristic evaluation test using the central excitation method.
Fig. 5 Images of test pieces cut at different angles (left) and their S-S curves (right)
The experimental results are shown by the dashed line in Figure 6. We can see that the natural frequency is higher in the 0° direction (= higher fiber orientation). Here, we can see that the first-order natural frequency differs by several hundred Hz between the 0° and 90° directions. The results of a similar test reproduced by Vibration analysis are shown in the solid line in Figure 6. Here, material data that takes anisotropy into account was created using Digimat and reflected in the analysis. The results obtained from the analysis, like the experimental results, showed that the higher the degree of fiber orientation, the higher the natural frequency, and the difference between the natural frequency obtained by the experiment and the analysis was only 5%.
Fig. 6 Glass-fiber orientation direction and natural frequency
Case studies-2
Effect of gate position on frequency characteristics in fiber-reinforced resin
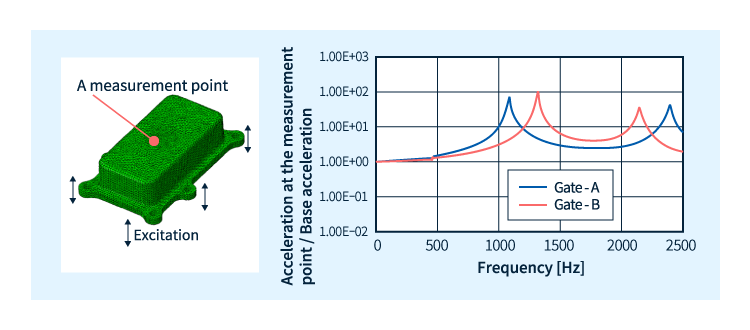
As mentioned above, the natural frequency can be changed by changing the fiber orientation. We will now introduce methods for actually changing the fiber orientation using an application example of a box part. Changing the injection molding gate position is an effective way to change the fiber orientation in an actual product. As shown in Figure 7, a comparative evaluation was performed using gate A (left) and gate B (right), and as shown in Figure 8, changing to gate B shifted the natural frequency to a higher position. When the desired natural frequency cannot be obtained, this approach is possible with glass-fiber reinforced materials.
Fig. 7 Gate A (left) and Gate B (right) filling pattern
Fig. 8 Measurement point (left) and frequency response analysis results (right)
Case studies-3
Effect of adding ribs and rib thickness on frequency characteristics
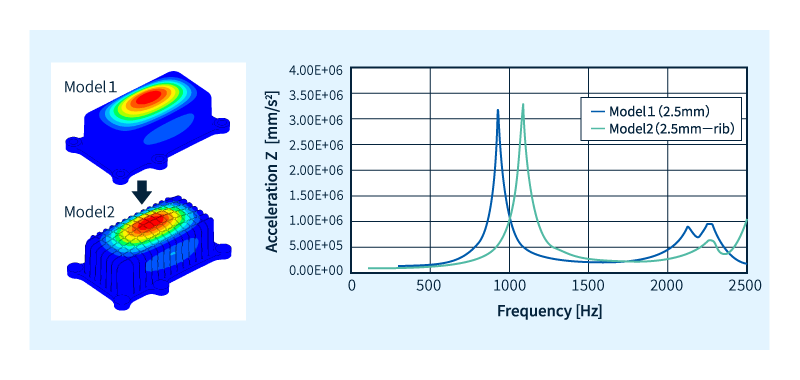
The natural frequency can be changed by adding ribs or changing the thickness of the ribs, in addition to glass-fiber orientation. As shown in Fig. 9, adding ribs increases the natural frequency, and reducing the thickness decreases the natural frequency (Fig. 10). In injection molding, it is relatively easy to change the shape like this, so it is effective to search for a better shape while analyzing.
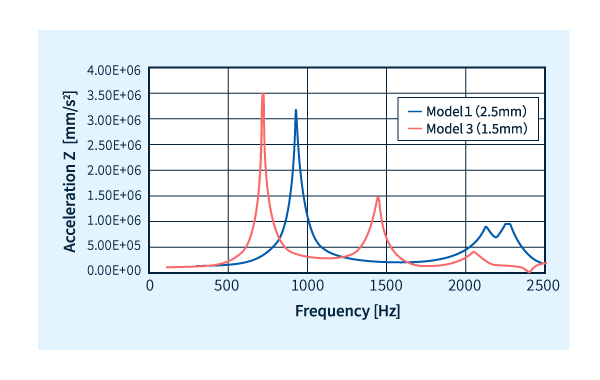
Fig.9 Change in natural frequency due to rib addition
Fig.10 Change in natural frequency due to thickness change (2.5mm→1.5mm)