Features

Injection molding analysis is the analysis the filling behavior of resin injected into a mold from an injection molding machine. 
It is a common analysis for plastic products in product design and mold specification design, and can predict flow patterns, resin pressure distribution, resin temperature distribution, weld line generation locations, etc. Based on the obtained results, it is possible to predict whether molding is possible or not, and to perform preliminary studies when fabricating molds.

Advantages/disadvantages of injection molding analysis
Fig. 1 Advantages/Disadvantages of Injection molding analysis

● For information on data acquisition for injection molding  analysis, please click here.

Case studies-1

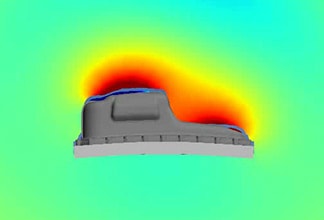
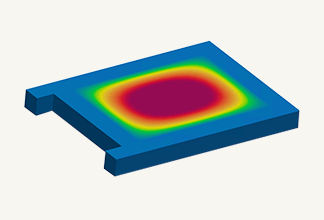
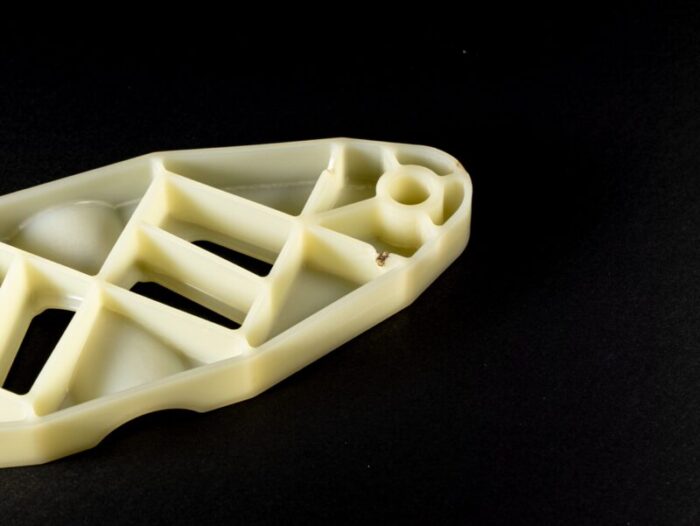
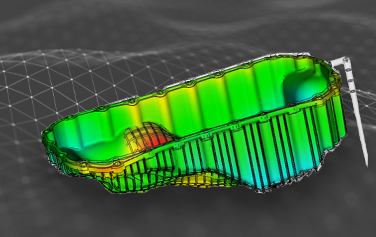
Gate position optimization

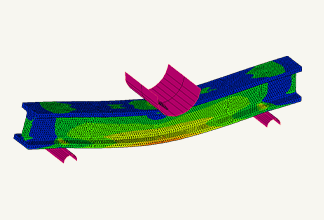
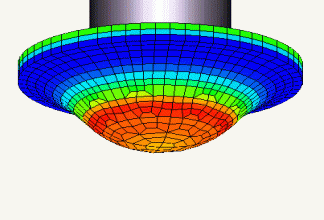
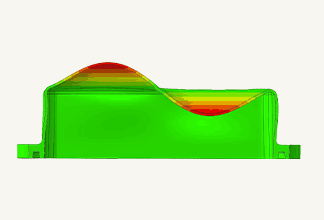
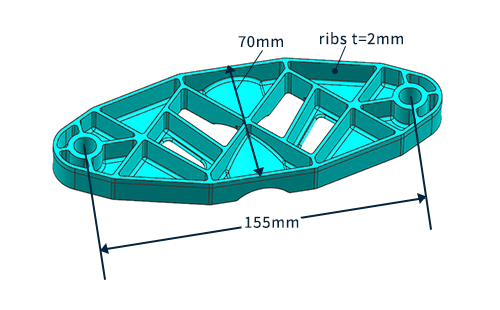
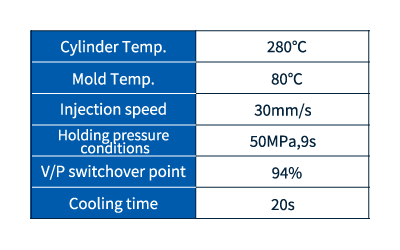
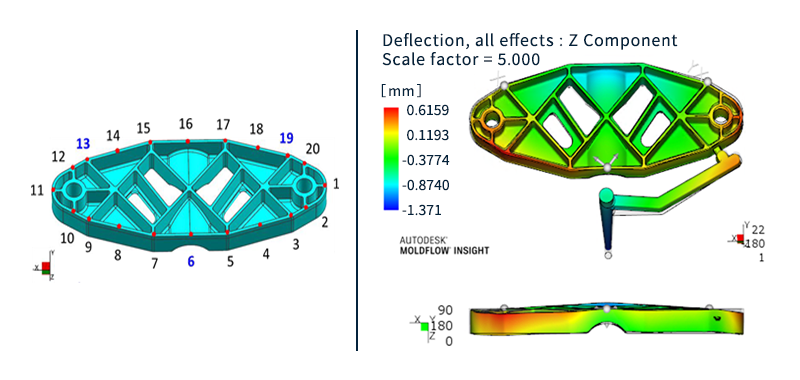
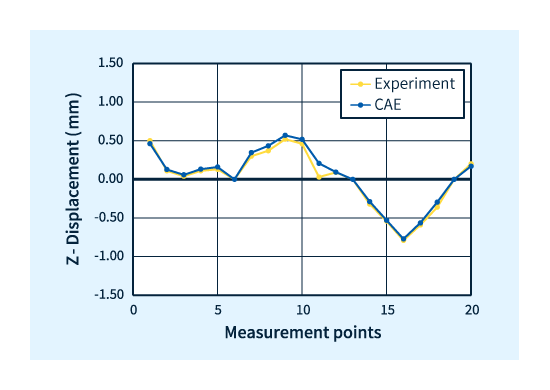
An oil pan of an automotive part was modeled, and the gate position was optimized to reduce warping deformation of the flange. Resin flowed along the flange to increase fiber orientation and improve rigidity. Comparison of the warp deformation obtained from the analysis with the actual warp deformation showed a close match.

For details, please see CAE Case Study "Accuracy Validation of Warpage Analysis".

Example of oil pan injection molding analysis
Fig. 2 Validation of optimal gate position and warpage prediction accuracy

Case studies-2

Verification of prediction accuracy of "warping" and "glass-fiber orientation"

The prediction accuracy of warpage and glass-fiber orientation was verified using a model (Fig. 3) that mimics the rear member of an automobile part. LEONA™ 14G35 (PA66, GF35%) was used in this verification. The actual molding conditions are shown in Fig. 4. These conditions were also entered in injection molding analysis.
By incorporating the actual molding conditions into the analysis, a better analysis can be performed.

使用したモデル
Fig. 3 Rear member model used
Molding
Conditions
Fig. 4 Molding conditions

Accuracy validation of warpage

The warpage was evaluated using the displacement in the Z-axis direction at measurement positions on the product. As shown in Figure 5 (left), 20 measurement positions were set on the outer rib, and anchor points necessary for setting the reference plane were set at numbers 6, 13, and 19. The results of the actual product were measured using a three-dimensional measuring device. For the analysis results, the Z-direction displacement output from Autodesk's Moldflow was used for comparison, as shown in Figure 5 (right).

測定位置(左)とZ方向変位量出力結果(右)
Fig. 5 Measurement points (left) and z-direction displacement output result (right)

Fig. 6 shows the experimental results and analysis results together. The amount of displacement matches well, indicating that the analysis was able to predict the actual warpage.

Comparison between experimental and analytical results
Fig. 6 Comparison between experimental and analytical results

Accuracy validation of glass fiber orientation

For fiber-reinforced resins containing glass fibers, such as the material used in this verification, fiber orientation can have a significant impact on product performance, and it is important to take this orientation into account. In order to know the fiber orientation information, the fiber orientation tensor is output by the injection molding analysis. The fiber orientation tensor was evaluated at a measurement position set slightly below the center of the product (Fig. 7 left).

測定箇所と光学顕微鏡で観察した断面像の例
Fig. 7 Measurement points and Cross-sectional image observed with an optical microscope 
(Numbers on the right of the image indicate the measurement position (%) in the cross-sectional depth direction)

The fiber orientation tensor is a probability distribution (0 to 1) of fiber orientations; in Autodesk's Moldflow, the fiber orientation tensor is evaluated in three axes: flow direction, flow orthogonal direction, and thickness direction, which are called a11 direction, a22 direction, and a33 direction, respectively. 
The actual value of the fiber orientation tensor was calculated from the image of the cross section of the product at the measurement position observed by optical microscope as shown in Fig. 7 (right) using an original method. In this case, the fiber orientation tensor was calculated by dividing it by 5% in the direction of the molded product thickness. As shown in Fig. 9, the obtained measured values (solid line) and the analyzed values (dashed line) are well matched, indicating that the actual fiber orientation tensor could be predicted by the analysis. As can be seen from Fig.7 (right) and Fig. 9, there are more glass fibers aligned in the flow direction (a11) on the molded product surface (measurement points: 70-90%), whereas in the center (measurement points: 40-60%), there are more glass fibers oriented in the orthogonal direction (a22), indicating a scattering.

Fiber orientation tensor output results
Fig. 8 Fiber orientation tensor output results
Comparison between experimental and analytical results
Fig. 9 Comparison between experimental and analytical results

Other CAE analysis technologies

Related information